Authentication
This provider requires authentication.- token: Token (required: True, sensitive: True)
- host: Grafana host (required: True, sensitive: False)
- datasource_uid: Datasource UID (required: False, sensitive: False)
- alert.rules:read: Read Grafana alert rules in a folder and its subfolders. (mandatory) (Documentation)
- alert.provisioning:read: Read all Grafana alert rules, notification policies, etc via provisioning API. (Documentation)
- alert.provisioning:write: Update all Grafana alert rules, notification policies, etc via provisioning API. (Documentation)
In workflows
This provider can’t be used as a “step” or “action” in workflows. If you want to use it, please let us know by creating an issue in the GitHub repository.Topology
This provider pulls topology to Keep. It could be used in correlations and mapping, and as a context for alerts and incidents.Connecting via Webhook (omnidirectional)
This provider supports webhooks. If your Grafana is unreachable from Keep, you can use the following webhook url to configure Grafana to send alerts to Keep:- In Grafana, go to the Alerting tab in the Grafana dashboard.
- Click on Contact points in the left sidebar and create a new one.
- Give it a name and select Webhook as kind of contact point with webhook url as KEEP_BACKEND_URL/alerts/event/grafana.
- Add ‘X-API-KEY’ as the request header .
- Save the webhook.
- Click on Notification policies in the left sidebar
- Click on “New child policy” under the “Default policy”
- Remove all matchers until you see the following: “If no matchers are specified, this notification policy will handle all alert instances.”
- Chose the webhook contact point you have just created under Contact point and click “Save Policy”
Legacy vs Unified Alerting
Keep supports both Grafana’s legacy alerting system and the newer Unified Alerting system. Here are the key differences:Legacy Alerting
- Uses notification channels for alert delivery
- Configured at the dashboard level
- Uses a different API endpoint (
/api/alertsand/api/alert-notifications) - Simpler setup but fewer features
- Alerts are tightly coupled with dashboard panels
Unified Alerting (Default from Grafana 9.0)
- Uses alert rules and contact points
- Configured centrally in the Alerting section
- Uses the newer
/api/v1/alertsendpoint - More powerful features including label-based routing
- Supports multiple data sources in a single alert rule
If you’re using Grafana 8.x or earlier, or have explicitly enabled legacy alerting in newer versions, make sure to configure Keep accordingly using the legacy alerting configuration.
Connecting with the Provider
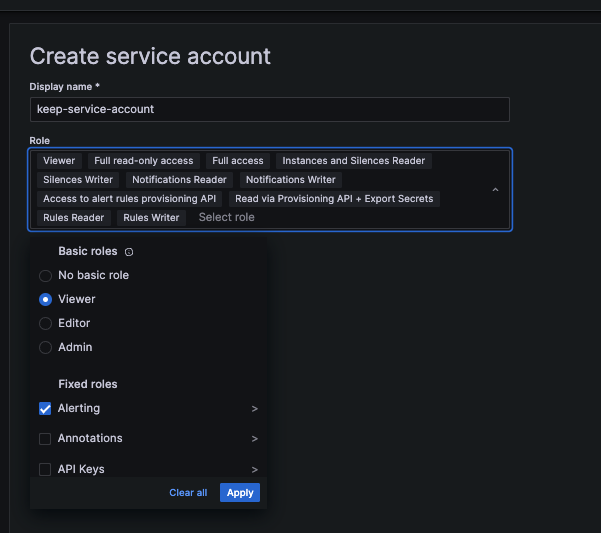
To connect to Grafana, you need to create an API Token:- Log in to your Grafana account.
- Go to the Service Accounts page (cmd+k -> service).
- Click the Add service account button and provide a name for your service account.
- Grant “alerting” permissions:
- Now generate Service Account Token:
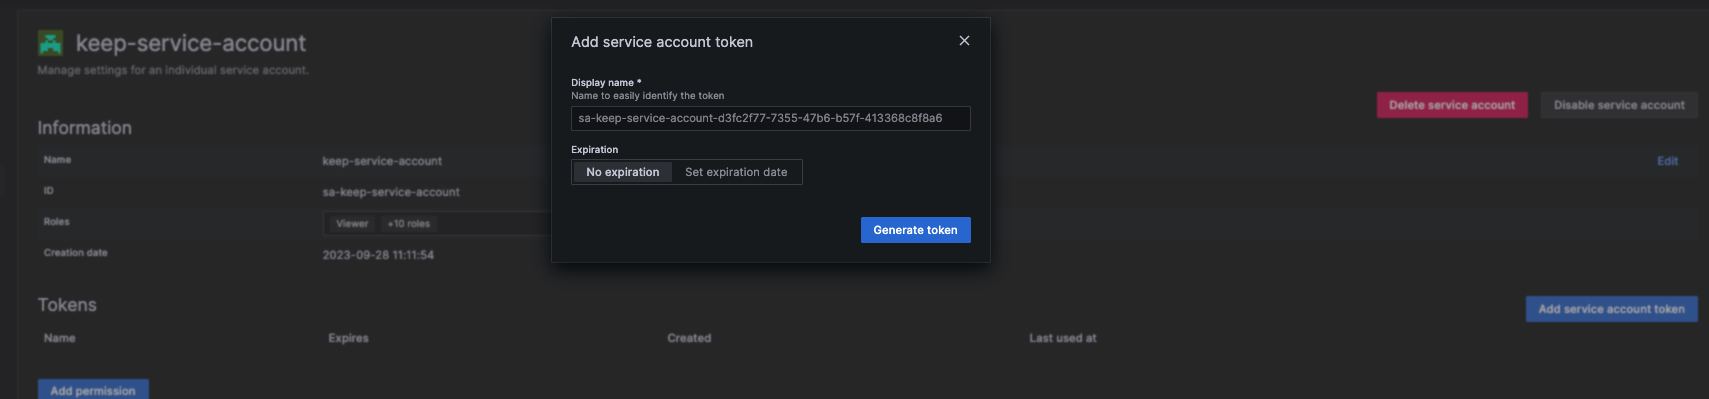
- Use the token value in the
authenticationsection in the Grafana Provider configuration.
Post Installation Validation
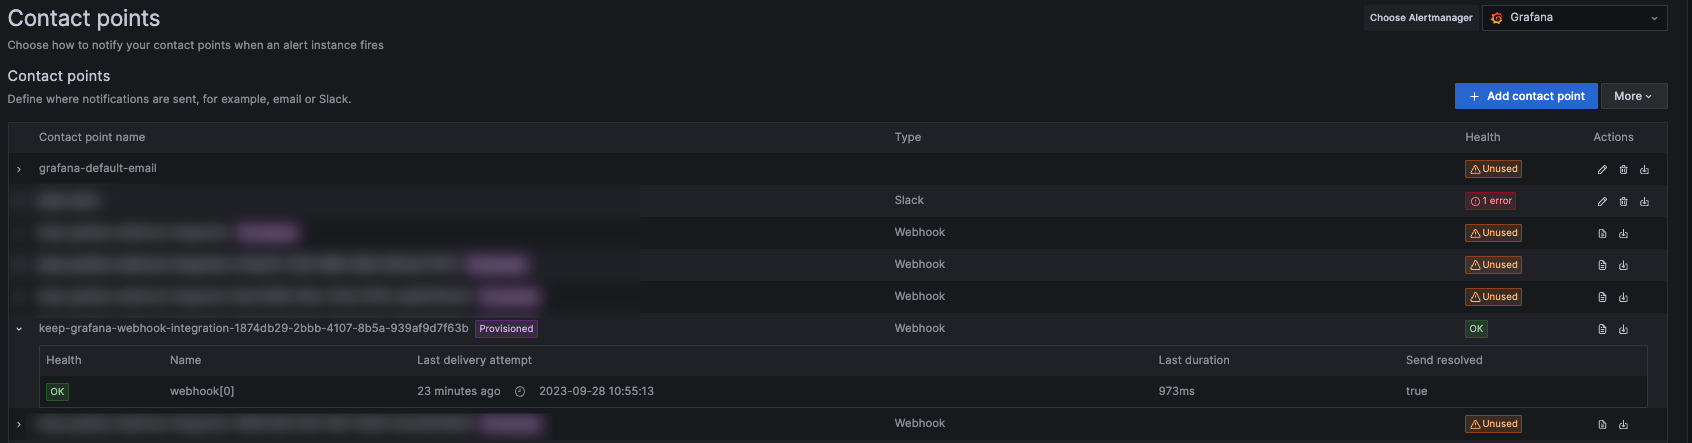
You can check that the Grafana Provider works by testing Keep’s contact point (which was installed via the webhook integration).- Go to Contact Points (cmd k -> contact).
- Find the keep-grafana-webhook-integration:
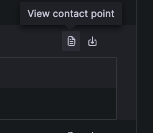
- Click on the View contact point:
- Click on Test:
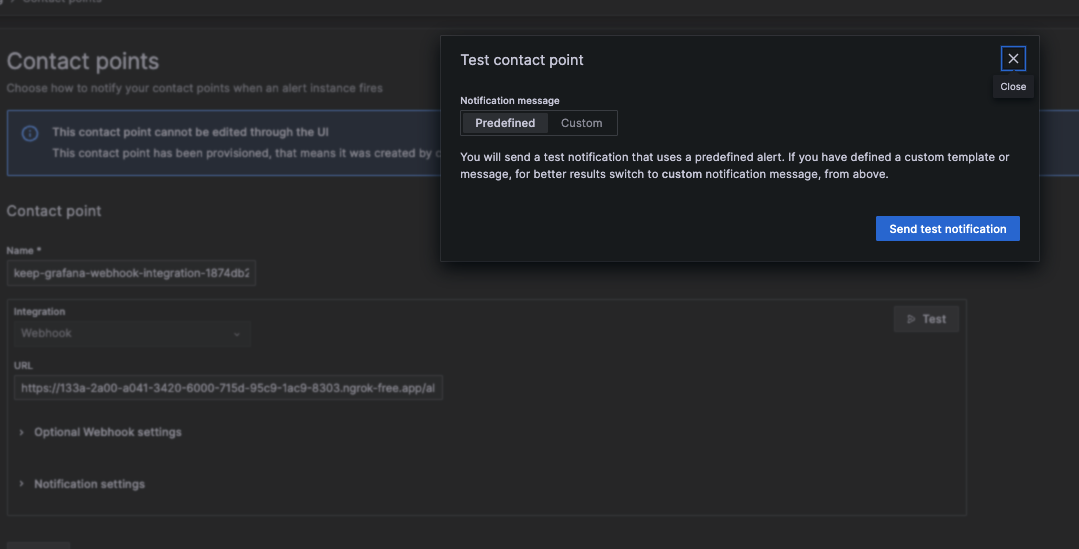
- Go to Keep - you should see an alert from Grafana!
-
Manual Test Alerts in Grafana:
- Create a manual test alert in Grafana.
- Set up a contact point within Grafana that would normally send alerts to Keep.
- Trigger the alert and check Grafana’s logs for errors or confirmation that the alert was sent.
-
Check Logs in Grafana:
- Access Grafana’s log files or use the Explore feature to query logs related to the alerting mechanism.
- Ensure there are no errors related to the webhook integration and that alerts are processed correctly.
-
Verify Integration Status:
- Navigate to the Alerting section in Grafana.
- Confirm that the integration status shows as active or functioning.
- Monitor any outbound HTTP requests to verify that Grafana is attempting to communicate with Keep.
-
Network and Connectivity Check:
- Use network monitoring tools to ensure Grafana can reach Keep or any alternative endpoint configured for alerts.
Service Topology
Grafana can contribute data to Keep’s Service Topology map when the provider is configured with a topology datasource UID. Keep queries Grafana service graph metrics from that datasource and uses theclient and server labels to build services and dependencies.
The Topology Map is generated from traces collected by Tempo and exposed through a Prometheus-compatible datasource.To get the Datasource UID, go to:
- Connections > Data Sources.
- Click the Prometheus instance that is scraping data from Tempo. The URL is in the format
https://host/connections/datasources/edit/<DATASOURCE_UID>. - Copy that DATASOURCE_UID and use it while installing the provider.
Webhook Integration Modifications
The webhook integration adds Keep as a contact point in the Grafana instance. This integration can be located under the “Contact Points” section. Keep also gains access to the following scopes:alert.provisioning:readalert.provisioning:write