QuickChart Provider
Overview
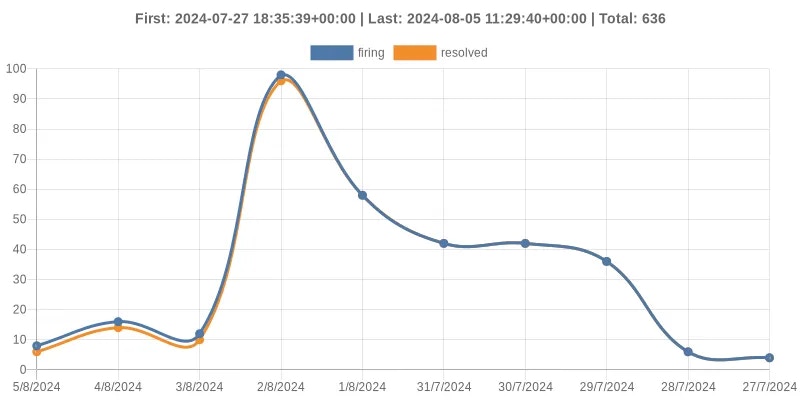
The QuickChart provider allows for the generation of two types of charts based on alert data within Keep’s platform:- A line chart that shows the trend of a specific fingerprint alert over time.
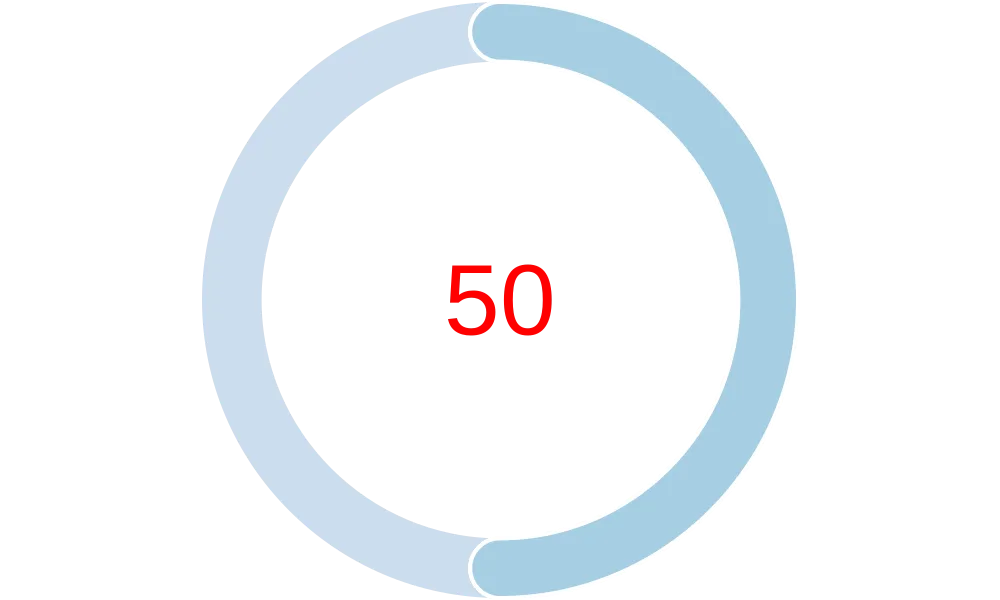
- A radial gauge chart displaying the total number of alerts Keep received for this fingerprint.
Authentication
This provider requires authentication.- api_key: Quickchart API Key (required: False, sensitive: True)
In workflows
This provider can be used in workflows. As “action” to make changes or update data, example:Connecting with the Provider
Using QuickChart without an API Key
The QuickChart provider can generate charts without the need for an API key. However, this usage is limited to basic functionality and lower request limits.Using QuickChart with an API Key
To unlock more advanced features and higher usage limits, you can use a QuickChart API key. Here’s how to obtain one:- Visit QuickChart.
- Sign up for a free account to get started.
- Navigate to your account settings to find your API key.